I hope I’ve not lost too many people as this week’s series dove into some of the more technical aspects of testing. It’s just that, having spent so many years in both the professional testing and education industries, it struck me how some of the principles of the former could really improve the quality of the latter.
This is especially true in the world of MOOCs where (1) huge classes can only work if most of the class components are automated; (2) the quality of automated test questions is based entirely on how well those questions are conceived and written; and (3) MOOCs can generate the type of “Big Data” needed to determine how well tests and test items are performing.
I’ll be returning to the subject of “Big Data” over the course of the year since many MOOC providers see the data they are gathering as one of the primary benefits of the entire MOOC experiment.
But for now, I’d like to focus on two types of analysis one can do with data collected when tens or even hundreds of thousands of people are taking the same automated assessments.
The first statistical analysis technique most of us are familiar with is norming. Norming utilizes a frequency distribution of test scores to determine how that student’s score compares with the scores of others taking the same test.
Within this kind of distribution, a test score of 62% might sound terrible, but if that score is associated with a percentile of 95, this means someone scoring 62% did better than 94% of everyone who took the same test (which both looks better for this one student and is more meaningful than the raw results).
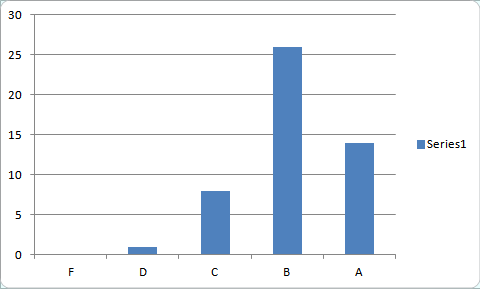
Norms can also point out when a scoring system might be doing something other than creating a meaningful, standardized distribution. For example, the distribution of letter grades at the end of a semester frequently looks something like this:
This kind of “bunching” at the A and B level would indicate that (1) lower grades (such as D and F) are not that useful as part of a distribution since they are assigned so infrequently (and are often eliminated from the sample due to students dropping the class before receiving a failing grade); (2) that final grades might be doing something other than determining the spread of mastery across a population. For example, a grade of B might simply serve as a baseline for everyone who completes all of the assignments for the class.
Let’s leave overall test scores for now to concentrate on the numbers associated with individual questions in a test.
One of the most important statistical values for a test question is called the p-value which indicates item difficulty. P is simply the decimal equivalent of the percentage of people who get the question right (for example, a p-value of .80 indicates that 80% of test takers answered the question correctly).
A slightly less intuitive item statistic is the r-value which compares how well people did on a test item with how well they did on the test as a whole. This number is also a decimal which theoretically can fall between zero and one (although r generally falls in the lower two-thirds of this range).
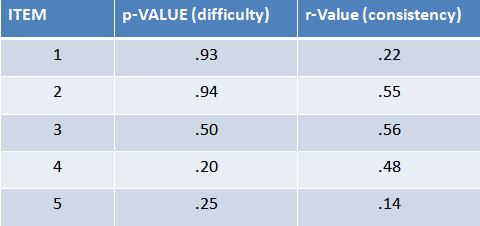
The r-value is critical in determining why an item might not be performing well. For example, take a look at these statistics associated with five different test items:
In this case, the first two items are pretty easy (with 93% and 94% getting the question correct) and the last two pretty hard (with only 20% or 25% answering the question right). Item 3 is perfectly in the middle (half get it right, and half get it wrong) which, in theory, makes it the best item for separating masters form non-masters.
But let’s take a look at those r-values for a moment. In the case of the easy items #1 and #2, the first has a very low r-value indicating that the few who are getting the question wrong are all over the map in terms of how they do on the total test. Item #2, in contrast, has a high r-value meaning that while few people get the question incorrect, those that do are likely to not do well on the total test.
Similarly, item #4 is really hard but the few people who get it right are the highest scorers on the test overall. In contrast, item #5 (which more people got correct than item #4) is doing a pretty crappy job distinguishing between high and low performers (since the very low r-value says that there is practically no correlation between how people do on this item and how they do on the test).
There is a great deal of insight to be gained by looking at these item stats. For example, the p- and r-values indicate that item #4 is very challenging, but probably a fair item. In contrast, item #5 is likley problematical (it might be programmed incorrectly if automated, or – if it’s a multiple choice question – it might contain confusing wording or responses that include more than one correct answer).
Similarly, items #1 and #2 are both pretty easy (and we should generally avoid tests with too many easy – as well as too many hard questions). But if we had to put one of these two in the test, #2 (the one with the higher r-value) provides more measurement bang than the slightly harder item #1.
Item #3 is actually a near perfect item. With a p-value of .5, it sits right in the middle of the curve, with half of test takers getting it right and half getting it wrong. And because it has such a high r-value, it looks like those who are getting it right are doing the best on the test overall.
Thousands of people taking the same test within a massive online course can generate enough data to support analysis of this type at both the item and test level which can lead to the creation of a subsequent generation of improved tests.
But we need to keep in mind some key differences between tests delivered in a MOOC environment and those delivered under more controlled circumstances, differences I’ll address tomorrow that can significantly impact on how much we can trust the assessment portion of the “Big Data” pile.


Is this correct?
” r-value … is also a decimal which theoretically can fall between zero and one.”
I’d guess this is a correlation coefficient, which can go from -1 to 1; but hopefully there would very seldom be any negatives in this situation.